Random.nextGaussian() (ctd)
We introduced the problem of a simulation, in
this case of a network, where we need to generate random numbers that cluster around an average.
In real life, values that "cluster" around an average tend to form a normal distribution,
also sometimes called a Gaussian distribution. The nextGaussian() method
lets us generate random numbers with this distribution.
Normal distribution
A normal distribution is essentially the way that values or measurements
tend to cluster around an average.
When values are influenced by a number of
random factors, they tend to have this type of distribution. Lots of things in real life
tend to be like that, from people's heights to timings of network packets.
Other distributions do also occur for certain things, but the normal distribution is very common.
Here is what a normal distribution looks like:
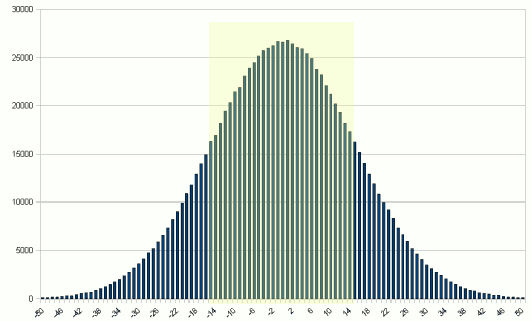
The x axis shows integer values between -50 and 50. The height of each bar
represents how many times a given x was returned by a random number generator
with a normal distribution.
In this case, the values have a mean (average) of zero, and a standard deviation
of 15 (because that's what we asked the generator for).
Standard deviation
A normal distribution will always have the same "basic shape" illustrated above.
The standard deviation then defines how "spread out" the distribution
is (imagine taking hold of the left and right edges of the graph and "stretching" it out
to give a larger standard deviation).
More specifically, the values will be spread out so that:
- Just under 70% of instances will tend to have a value one standard deviation
either side of the average (in this case, values between -15 and 15: see highlighted
area of graph)1;
- Just under 95% of instances will tend to have a value two standard deviations
either side of the average (between -30 and 30 in this case);
- More than 99% of instances will tend to have a value three standard deviations
either side of the average (between -45 and 45 in this case).
(Note that, as we'll see below, we can similarly
define typical limits for 99.9%, 99.99%, 99.999% etc, but
there's no value where we can guarantee covering 100% of values!)
Using nextGaussian()
Now, with a bit of background, we can explain how we used nextGaussian()
to produce the above graph.
The nextGaussian() method returns random numbers with a
mean of 0 and a standard deviation of 1.
Remember, that this means that numbers returned by nextGaussian() will tend to
"cluster" around 0 with the above shape, and that (approximately) 70% of values will be between -1 and 1.
Based on the values returned by nextGaussian(), we can scale and shift them
to get other normal distributions:
- to change the maen (average) of the distribution, we
add the required value;
- to change the standard deviation, we
multiply the value.
To produce the above graph, with an average value of 0 and a standard deviation
of 15, we called:
Actually, because we wanted to get integer values, we called:
int val = (int) Math.round(r.nextGaussian() * 15);
Now, in our network simultation, to generate values with an average of 500 and
a standard deviation of 100, we call:
double val = r.nextGaussian() * 100 + 500;
int millisDelay = (int) Math.round(val);
Remember, with a standard deviation of 100,
this means that 70% of values will fall between 500 +/- 100, in other
words between 400 and 600 milliseconds; 95% of values will fall between
300 and 700 milliseconds. We can argue about (and calculate from actual
measurements) what a realistic standard deviation is, but in any case,
the result is going to be more realistic than calling nextInt(1000)
and allowing, say, a time of 50ms to have the same likelihood as a time of 500ms.
What are the minimum and maximum values with nextGaussian()?
One thing that you may be wondering is what is the absolute minimum
and maximum that nextGaussian() can return, or that could occur, say, in
our network simulation with average 500ms and standard deviation 100ms.
Well, theoretically at least, the slightly paradoxical answer is:
There is theoretically no absoluate minimum and maximum value
that can occur in a normal distribution.
Theoretically, the x axis of our graph above would extend to infinity
in either direction; the closer you get to infinity, the more infinitessimally
small the probability of that value occurring, but it could still occur...
mathematically.
In practice with Random.nextGaussian(), there will be some actual minimum/maximum, but not
necessarily where we want it to be.
The actual minimum/maximum is determined by the fact that
nextGaussian() returns a double, and by the
underlying psuedo-random number generator that in most cases will have some fixed sequence length
(so there'll be some actual minimum or maximum out of all the possible numbers it could generate,
if you're able to sit and wait for it to generate them all).
Anyway, leaving the theory aside, the practical upshot is
that nextGaussian() could sooner or later
produce values outside our expected range. If we've chosen our standard
deviation carefully, it may produce them with very very
small probability; but eventually, it could produce them.
For example, in our
network simulation, if we leave the code as above, we risk very
occasionally getting a negative network delay!
This means that in most practical applications, we need to
impose some artificial constraints on the range of values we allow.
For example, in our network simulation, we deliberately discard negative
(or zero) values:
int delay;
do {
  double val = r.nextGaussian() * 100 + 500;
  delay = (int) Math.round(val);
} while (delay <= 0);
1. The figure quoted in some maths texts is 68.2%
to one decimal place. But when we're talking about
simulations, 70% is generally easier to remember and just as good
a guide in practice.
If you enjoy this Java programming article, please share with friends and colleagues. Follow the author on Twitter for the latest news and rants.
Editorial page content written by Neil Coffey. Copyright © Javamex UK 2021. All rights reserved.
